AOV helps with visualization, strategic assessment, and decision support
for initiatives tied to Arctic Observing. View the “who,” “what,” “where,” and “when”
of Arctic environmental monitoring activities.
Assess status. Locate gaps to fill. Gauge progress.
Coordinate. Collaborate. Optimize.
Note: AOV is no longer supported by the US National Science Foundation. Hosting is currently provided free of charge by the University of Texas at El Paso Systems Ecology Lab in conjunction with ESRI.
What is AOV?
The Arctic Observing Viewer is a web mapping application in support of U.S. SEARCH, AON, and other Arctic Observing networks. A collaborative effort, it helps answer the questions:
How can we know where to go if we don't know where we've been?
What resources already exist?
Is there overlap? Where are the gaps?
Is it another data catalog?
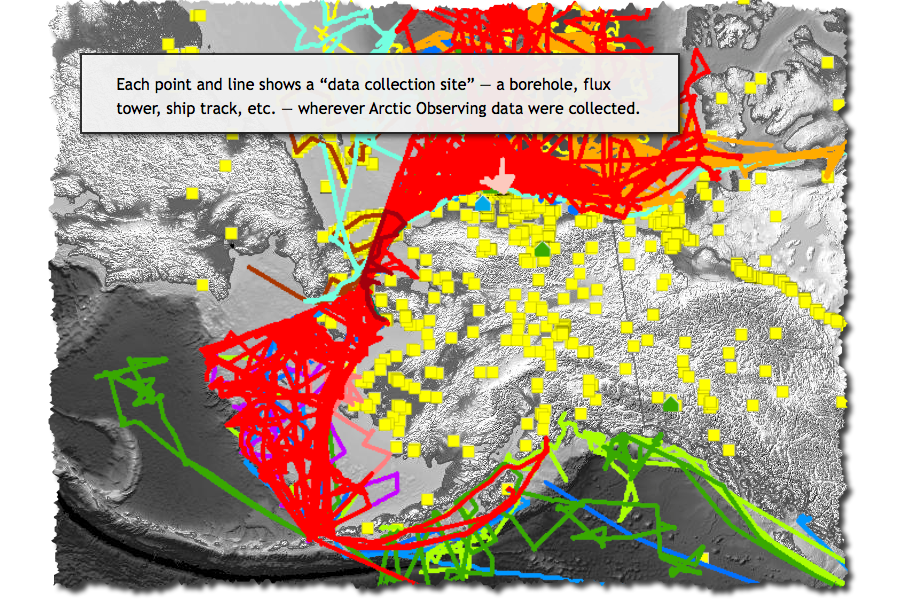
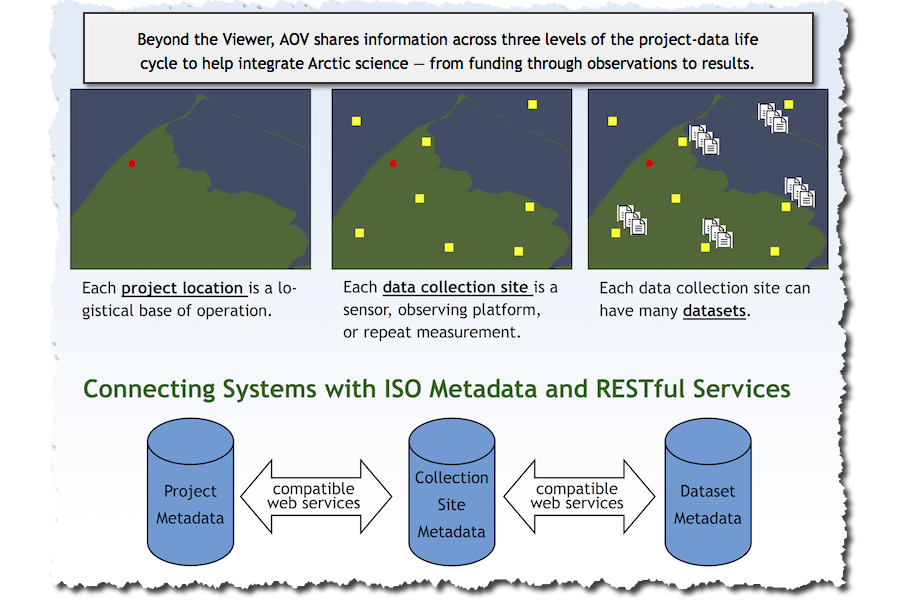
No. AOV displays observing sites: long-term monitoring locations such as towers, boreholes, moorings, ship tracks, weather stations, vegetation plots, stream gauges, shoreline transects, observatories, etc. You can still access data, but the scientific datasets themselves are best housed and maintained by data centers, while AOV provides higher resolution and more detail than project tracking systems. It is "an observing system for observing systems".
Who is it for?
AOV is primarily for policy makers, science planners, and data management specialists. Use the viewer -- as well as distributed web services -- to better plan, coordinate, and achieve monitoring objectives. For example: showcase your network, identify co-location of resources, avoid duplication, and clarify directions.
Become a Partner to view your monitoring sites in a larger perspective.
Features
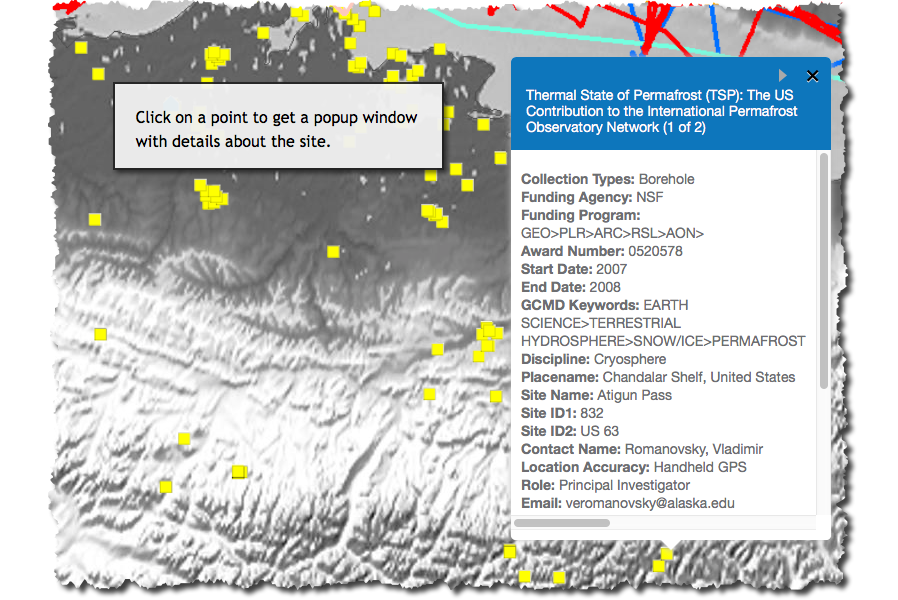
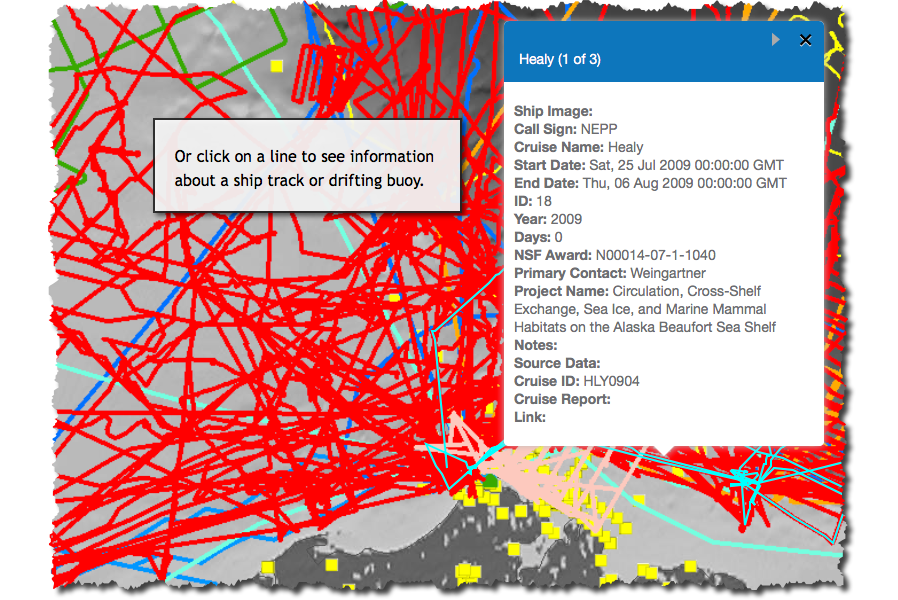
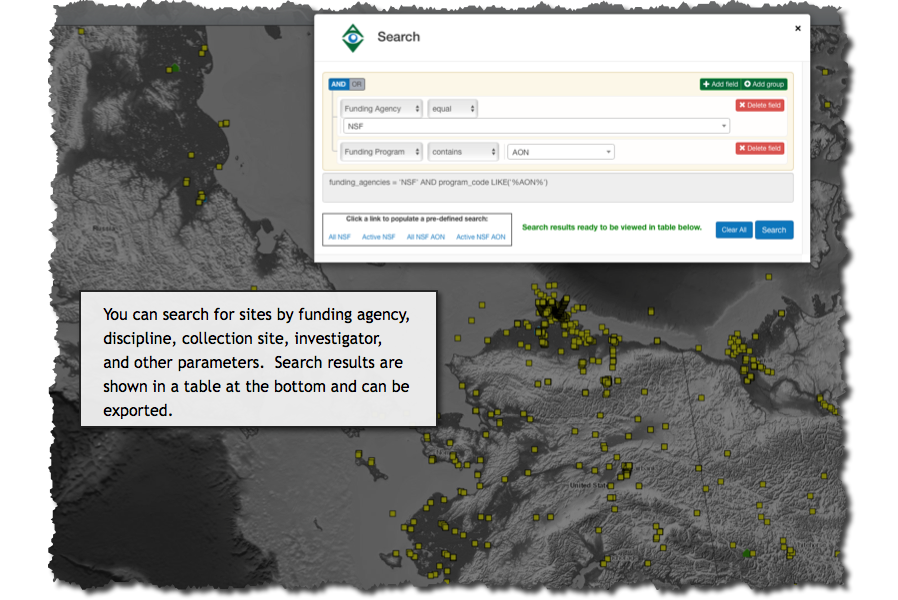
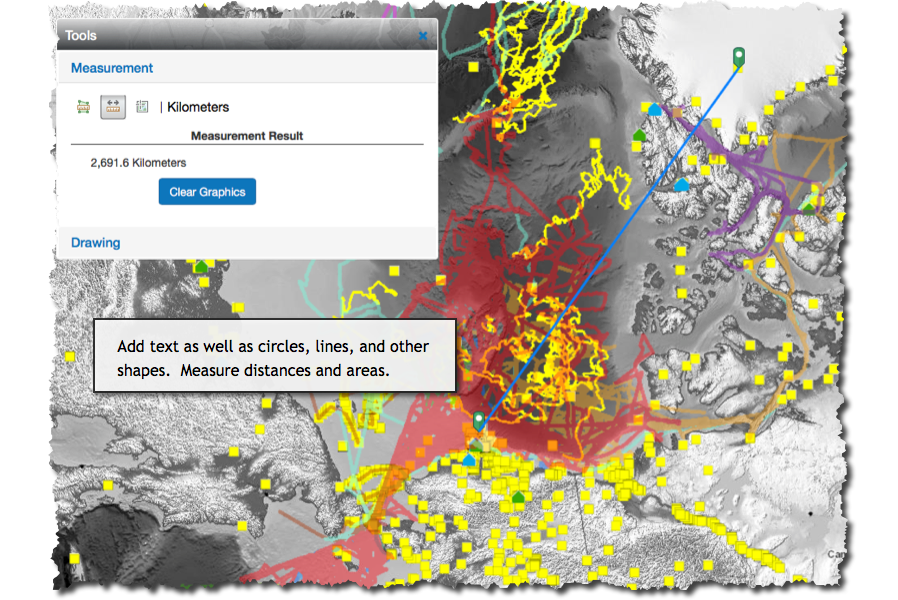
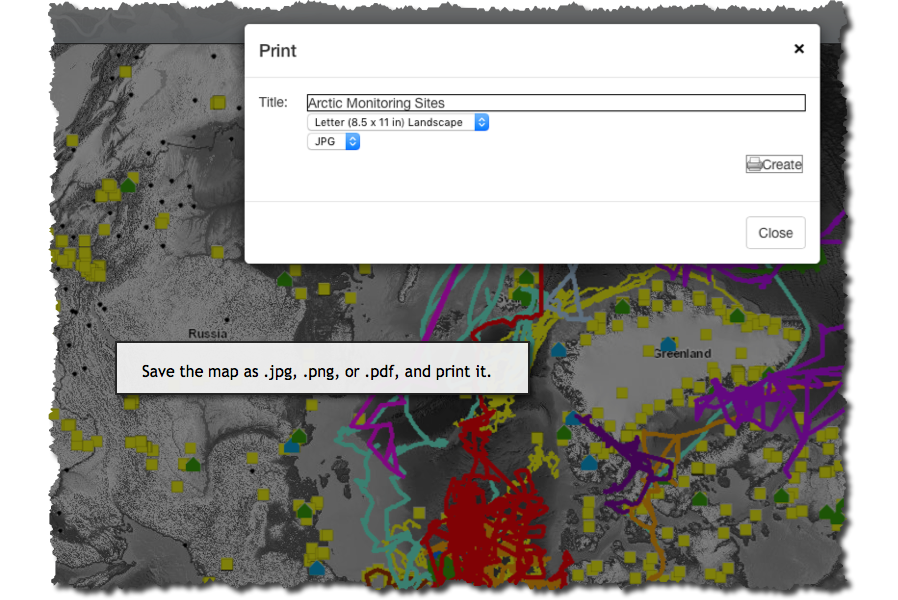
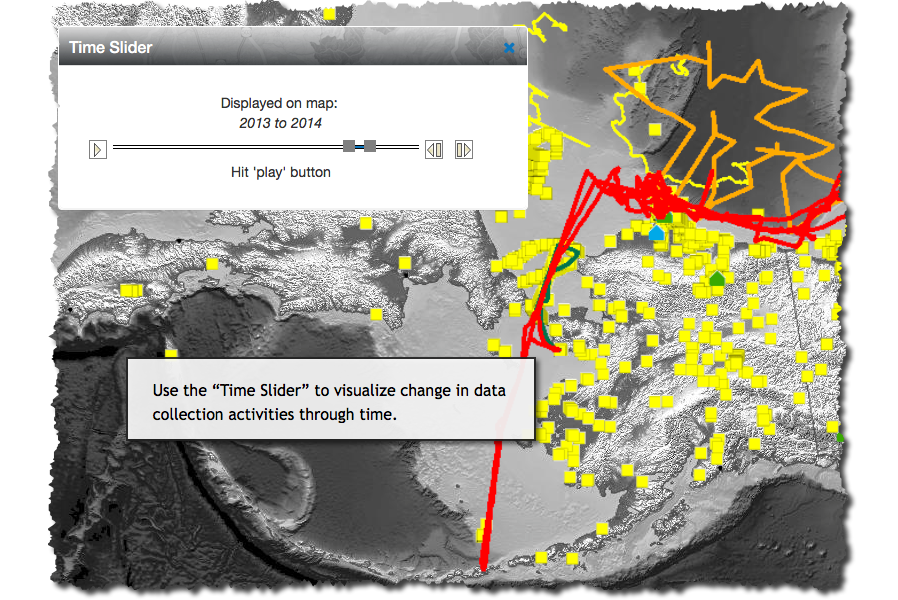
Displayed are thousands of sites with repeat measurements, with details such as: project title, funding agency, discipline, type of measurement, contact information, and links to datasets. Users can visualize, navigate, select, search, draw, print, export, and more. Click through the screenshots below for a quick overview:


